
What it does
The program reads a large file from a network share in a loop while measuring the peer's response time. The load runs for as long as you need — hours are perfectly fine. The point is not to measure a record speed but to find out whether the adapter holds up under sustained full load without dropping out.
The ready-to-run program is a single LANtester.exe. No installation — copy the file over and run it. It runs on .NET Framework 4.8, which ships with Windows, so there is nothing to install on the machine under test.
Usage
-
Share / drive
For example
\\192.168.1.100\share, a mapped drive such asZ:\, or a local folder. Browse… (or a double-click in the field) opens the folder picker. The share must contain at least one large file — 1 GB or more works best — to be read over and over. The program finds every file above 64 kB and starts with the largest.A bare server name such as
\\192.168.1.100is not a folder — Windows answers error 67 (the network name cannot be found), because a share name is missing. Enter one, or let the program list the server's shares: type\\192.168.1.100and press Browse… (or Start test) and pick from the list. -
User / password
Only needed when the share requires a different account. The program uses
WNetAddConnection2and drops the connection again when the test stops. -
Ping host
Filled in automatically from the path and can be overridden, e.g. to point at the router instead. For a mapped drive the program looks up the server behind the letter, so
Z:\still pings the right machine. A local folder has no host, so the ping simply stays off. -
Start test
It runs until you stop it.
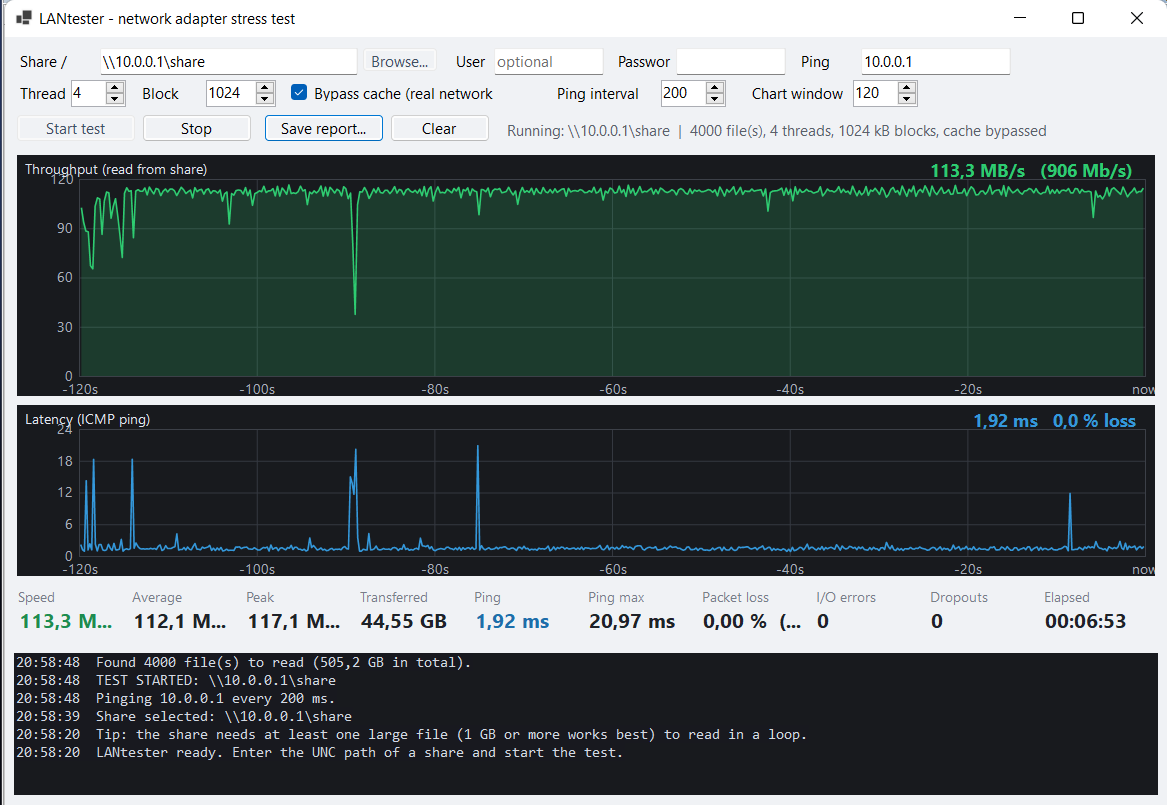 Enlarge
Settings
| Setting | Default | What it does |
|---|---|---|
| Threads | 4 | Parallel read streams. 2–4 saturate a 1 Gb/s link, 8–16 suit 10 Gb/s. |
| Block (kB) | 1024 | Size of a single read. Smaller blocks = more requests = more per-packet overhead on the NIC. |
| Bypass cache | on | Important. See the explanation below. |
| Ping interval | 200 ms | Five pings per second. Shorter = finer dropout detection. |
| Chart window | 120 s | How many seconds of history stay visible. |
Bypassing the cache
Windows caches SMB file content in RAM. Without this option the file would be fetched once and every following cycle would be served from memory — the NIC would sit idle and the chart would show a nonsensical few GB/s.
The option enables FILE_FLAG_NO_BUFFERING, so every byte really crosses the wire. If the share does not support it, the program falls back to normal reads and says so in the log.
What it watches
- Throughput — top chart, sampled every 250 ms, in MB/s and Mb/s.
- Latency — bottom chart, ICMP ping. A loss shows as a red vertical line and a gap in the curve.
- Transfer dropout — when no data arrives for more than 1 s, it is logged with its duration and counted in the Dropouts box.
- I/O errors — every read failure (share disconnected, connection reset) goes to the log and the counter.
- Packet loss — lost pings out of the total sent.
How a failing adapter looks
A failing or overheating NIC typically looks like this: throughput holds the nominal rate for a while, then collapses to zero for several seconds, the ping drops out at the same moment, and the log fills with I/O ERROR and TRANSFER DROPOUT. A healthy adapter runs for hours with zero dropouts and a flat ping line.
The report
Save report… writes a single self-contained HTML file — no external files, no internet needed — so it can be mailed as one attachment or archived with the job. It contains:
- a verdict at the top: stable, stable with reservations, or problems detected, with the reasons spelled out;
- stat tiles — average / peak / minimum throughput, total transferred, ping average and maximum, packet loss, dropouts, I/O errors, duration;
- a throughput chart and a latency chart over the whole run. Each shows the average per interval as a line with the min–max range behind it, so a one-second collapse stays visible even in an eight-hour test. Dropouts are marked in red on the throughput chart, lost pings on the latency chart. Hovering reads out the exact values;
- the event log, the test setup, and the network adapters that carried the traffic (link speed, MAC, IPv4) — the part a report about a network card needs;
- a collapsible data table with every interval, for when the numbers matter more than the picture.
The page follows the reader's light or dark theme and is laid out to print cleanly.
A note on ping measurement
Latency is measured with a stopwatch around Ping.Send(), because RoundtripTime has a resolution of whole milliseconds and just returns 0 on a LAN. The cost is a constant .NET overhead of roughly 0.3–0.5 ms, so absolute values are that much higher — irrelevant for the purpose here (spikes, jitter, losses). The ping thread runs at a higher priority than the load threads so the chart shows network delay rather than scheduler delay.
Requirements
- Windows 10 or Windows 11 (64-bit).
- Access to an SMB share holding at least one large file, or a local folder.
- .NET Framework 4.8, see the note at the top of the page.
- The ping needs the peer to answer ICMP; otherwise the latency chart stays empty.